In large part due to SFC’s research and advocacy work, East Austin has long been identified as one of the city’s most significant food deserts, with fewer grocery stores and a slimmer variety of fresh food than other areas of town. As a result, farmers’ markets have gravitated east of I-35 in an attempt to fill the nutritional gap, and the new SFC East market is the latest member of that growing club. (The Mueller Development, just a few blocks north of the giant peaches, hosts a Sunday market under the old airport hangar, and is also the site of a new HEB. Three miles to the south, HOPE Farmers Market hosts a small market at Plaza Saltillo. Boggy Creek Farm, two miles east of HOPE, has been selling fresh produce for 23 years.)
Location, Location, Location
Notably, East Austin is not the only part of town facing food-accessibility challenges. As this map (below) of urban Travis County demonstrates, accessibility decreases with distance from the city center, particularly in Southeast Austin but in other areas as well, including portions of Northeast and South Austin. Based on 2010 data from the U.S. Department of Agriculture, the map shows the percentage of residents per census tract who are low-income and live at least one mile from a supermarket. The darker blue tracts are those with the highest shares of low-income/low-access residents; the lighter the blue, the fewer low-income/low-access residents. (Because the metrics for measuring accessibility differ for rural census tracts, this map includes urban tracts only.)
Proximity to grocery stores is particularly important for people with low incomes, as they may not have ready means of transportation. A preponderance of fast food restaurants and convenience stores tend to fill in the void—as those evening commuters on Airport Boulevard know, just past the SFC’s billboard sit a Taco Bell, Whataburger, Popeyes, Sonic, Jack in the Box, and McDonald’s, one after the other. Food deserts are characterized not necessarily by a lack of food but by a lack of variety, particularly of fresh produce—with serious implications for health outcomes.
All around the country, organizations like SFC are exploring farmers’ markets as part of the solution to this problem. The USDA’s declaration last August of a National Farmers Market Week is a testament to this growing focus on farmers’ markets, not just as a solution to accessibility issues but also as a way to help small farms stay afloat, keep economies local, and address a laundry list of environmental ills. The USDA administers a national directory of farmers’ markets that turns 20 this year, and the number of markets has more than quadrupled since its founding. In 2012 alone, the number of winter markets increased by 52%.
Supply and Demand
Nonetheless, more isn’t necessarily better. As the map demonstrates, though Travis County has several active farmers’ markets, few are located in the tracts most in need, and there aren’t nearly enough in total to reach all low-access communities, particularly in the tracts farthest from the city center.
At the same time, the current number of markets may already be challenging the capacity of local farms, says Kate Vickery, a food policy expert and graduate student at UT’s LBJ School of Public Affairs and Community and Regional Planning Program. Vickery notes that Austin already has too many markets for its farmer base. “Direct consumer sales” are best for farmers, she says, but that’s a challenge when they have to “staff five markets instead of one, without an increase in overall sales.” Moreover, she adds, “the customer base just isn’t growing that fast.” Many farmers share the sentiment, she says, that there are about the same number of customers today as there were a few years ago, when there were fewer markets.
While local organizations like the Moontower Co-op are working to reduce barriers to entry for new farmers, market managers are working to expand the customer base by increasing access. But it’s clear that proximity is only one of many components to accessibility. For instance, while location is key, so is connectivity. Though some Travis County farmers’ markets are served by bus routes, the farther a market gets from the city center—and the closer to low-access populations—the fewer public transportation options there are. (Click on any farmers’ market on the map to see which bus routes are within a half-mile of a market.)
Katherine Lieberknecht, a lecturer in UT’s Community and Regional Planning program, points out that even seemingly walkable distances can be problematic. “Miles are measured as the crow flies,” she says, but even something as simple as a fence ringing a large grocery store property can limit access. While solutions can be as simple as a well-placed “neighbor gate,” other factors also matter, she says. “Traffic, noise, shade, lighting, and safety” all come into play.
Double the Dollar, Double the Effort
Accessibility isn’t just about geography—economics matter, too. “Farmers’ markets aren’t always cheaper,” says SFC Food Access Manager Claudia Harding. “That, to me, is not a form of access.” Recent studies show that local farmers’ market prices in some places—in Seattle, Iowa, and Vermont, for example—do beat out prices at local supermarkets, but no such study has taken place in Austin.
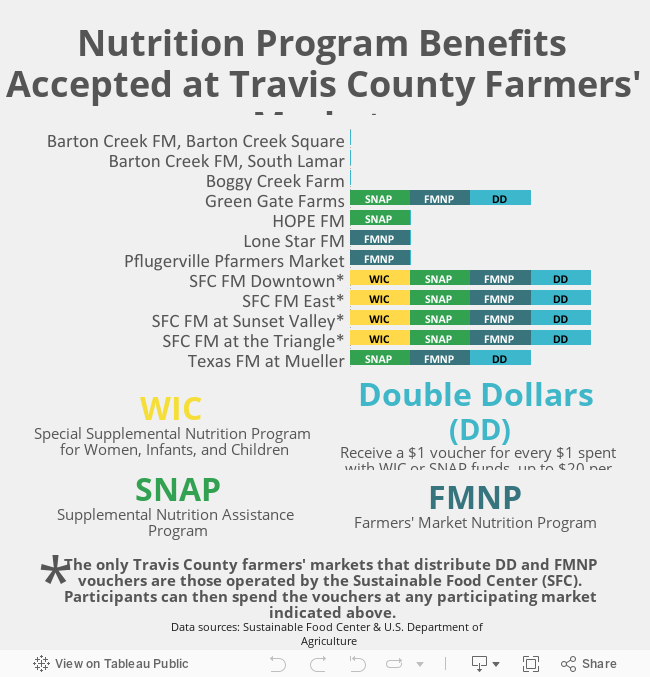
To address affordability issues, the SFC is part of a federal pilot program encouraging participants in SNAP (Special Supplemental Nutrition Program) and WIC (SNAP for Women, Infants, and Children) to spend their benefits at farmers’ markets. The Double Dollars program (prominently advertised on SFC’s billboard) uses a voucher system to double the value of each dollar spent using WIC or SNAP. The system is admittedly complicated, though. It can be used only for fruits and vegetables and only for amounts up to $20 per week. Moreover, while several farmers’ markets accept vouchers, only SFC distributes them, so customers have to shop at one of SFC’s four markets in order to receive Double Dollar vouchers in the first place.
Nonetheless, just a year-and-a-half into the program, the system is improving, says Harding. She points out that administrative changes effective in March—based on SFC feedback from the pilot’s first year—have already begun to improve the cumbersome logistics for vendors. Ideally, the program will improve to the point that all farmers’ markets can participate. Another federal program—the Farmers Market Nutritional Program (FMNP)—provides funds to be spent specifically at farmers’ markets. The most recent federal farm bill increases funding allocated to this program, Harding notes. But like Double Dollars, FMNP vouchers are distributed only at certain locations. The table below shows which markets distribute and accept the various federal nutrition program benefits.
Weekday Warriors
Boggy Creek Farm (technically a farm stand rather than a market) does not accept federal program funds, but as co-owner Carol Ann Sayle points out, "Accessibility isn't all about the financial aspect. It's also about when you're open." Beginning last month, Boggy Creek is experimenting with a new schedule doubling its market days from two to four each week (through July 31) in order to reach people with busy schedules.
Lieberknecht agrees that the traditional market schedule is a “limiting factor” for access. Farmers’ markets are usually “structured as a fun, leisurely weekend activity,” says Lieberknecht, “but for working families, that can be challenging.” Other markets are joining Boggy Creek in moving beyond the weekend model, including SFC, Pflugerville, and Green Gate. (See the timeline below for the schedules of all Travis County farmers’ markets.)
SFC’s East market, as advertised on its billboard, is open “Tuesdays/Martes 3-7pm” in an effort to reach people on the way home from work. The market, which has been open for one year at its current location (on MLK Boulevard, just west of Airport), represents a second stab at trying to reach an underserved market. Originally, says Harding, SFC—drawing on community feedback and focus group research—located the market farther east, with a morning schedule. When that arrangement didn’t draw enough customers, SFC had to make a trade-off, moving the market away from the lowest-access tracts but closer to major commuting arterials and bus routes. The new location also abuts the MLK Jr. stop of the MetroRail (another notable feature advertised on the billboard).
Farm to Everywhere
Market managers are increasingly exploring creative ways to reach people outside the traditional model. Richie Romero, founder of the Lone Star Farmers Market, says that unfamiliar foods themselves are a significant barrier. “People are reluctant when presented with unusual vegetables,” he says. He works with chefs to cook on-site (so that customers can “smell the smells” and learn how to prepare the food) and to produce to-go meals that are available at a variety of locations. He also plans to open a farm-to-table restaurant showcasing doable recipes sourced from native foods.
According to Jessie Curry of HOPE Farmers Market, mobile farm stands—such as the one HOPE will debut this summer—are another way to bring food and education to people where they work or go to school. Based on a similar philosophy, SFC has Farm to Work and Farm to School programs that follow the membership-based Community Supported Agriculture (CSA) model to bring fresh produce to participants on a regular schedule. Carla Jenkins of the Texas Farmers Market partners with Keep Austin Fed to ensure that leftover food doesn’t go to waste, and the market hosts cooking programs focused on children’s education.
With the school year winding down, children who otherwise rely on free and reduced-price lunches face particular challenges in the summer. As program coordinator for the Andy Roddick Foundation, Brigid Mejia works with low-income children to improve educational outcomes through an emphasis on physical health. From her headquarters in far East Austin, near Decker Lane and MLK Boulevard, Mejia notes that the nearest grocery store is 11 miles away: “In terms of accessibility,” she says, “I’ve never seen it so in-your-face.” The foundation’s summer camp feeds children twice a day and sends them home “with a heavy snack,” she says. As part of the program, she has also arranged for a mobile, “mini” farmers’ market program, with help from HOPE and others. “Kids will leave with bags of produce,” she says.
A Culture of Access
“On the surface, yes, it’s a great idea” to address food-accessibility challenges with farmers’ markets, says Harding. “But when you look at it, they don’t address access in the way we want them to.” In every aspect of the dilemma—from proximity and connectivity to affordability and basic scheduling—farmers’ markets face limitations. Nonetheless, she notes, they are making great strides, particularly with increased use of WIC, SNAP, and FMNP. It’s clear that while farmer’s markets are just a part of the solution, they are still a growing part. Right now, says Lieberknecht, “the agricultural system is so uniform.” In Travis County, farmers’ markets—and the new models of access they are exploring—are bringing much-needed diversity to that system.